The Bottom Line: Hotels prepare F&B for snowbird season by forecasting demand for each outlet using booking pace, past consumption data, local event schedules, and real-time outlet sales. They then adjust par levels and place orders 60 to 90 days before peak arrivals. WISK integrates sales data from over 60 POS systems to streamline forecasting and par level management, enabling restaurants, bars, and banquet services to open fully stocked without excess inventory tying up capital.
This guide is designed for Hotel F&B Directors, General Managers, and operators of resorts and seasonal properties who want to plan their peak season based on data rather than relying on last winter’s orders.
When should hotels begin F&B preparations for snowbird season?
Start 90 days before your first busy week: develop the demand forecast at 90 days, finalize par levels and vendor agreements by 60 days, and perform a full inventory count at 30 days. This timeline allows purchasing to secure volume pricing and gives teams time to address any gaps before guests arrive.
- 90 days out: Analyze last season’s outlet consumption and overlay current booking trends. For a peak in mid-January, this means starting in mid-October.
- 60 days out: Convert forecasts into item-level par levels, confirm allocations on fast-moving wines and spirits with distributors, and schedule deliveries around peak days.
- 30 days out: Conduct a full outlet inventory, compare stock to new par levels, and place stock-building orders.
Seasonal properties that close off-season face challenges due to lack of shoulder-season data, relying heavily on last peak’s consumption and banquet contracts for forecasting.
Why is it risky to base this season’s plan solely on last season’s numbers?
Because market conditions fluctuate. For example, Canadian travel to the U.S. dropped 22% in January 2026 compared to the previous year, impacting guest counts, beverage sales, and banquet attendance.
Numbers can also be misleading; April 2026 showed a 1.4% increase year-over-year but still remained 30% below April 2024 levels.
Therefore, compare multiple prior seasons and prioritize weekly updated leading indicators over fixed calendar data. For General Managers, this means revisiting the F&B budget after booking pace solidifies.

What data should F&B teams use to forecast seasonal demand?
Combine five key inputs: booking pace, historical consumption, occupancy forecasts, local events, and actual outlet sales. Room forecasts estimate guest numbers; outlet data predicts their ordering behavior.
- Booking pace: Current room bookings compared to the same dates in previous years.
- Historical consumption: Actual item usage by outlet during the last peak, not just orders placed.
- Occupancy forecast: Revenue manager’s projected occupied room nights.
- Local events: External events that bring additional visitors to outlets.
- Actual outlet sales: Daily POS data reviewed once the season begins to validate or adjust forecasts.
How to convert occupancy forecasts into F&B par levels?
Calculate last season’s F&B usage per occupied room night, multiply by forecasted room nights, then set par levels as daily usage times ideal stock days. For example, a 250-room resort increasing occupancy from 55% to 88% with a 10% event lift requires 1.76 times its shoulder-season par levels.
At $18,000 weekly shoulder-season usage with 7 ideal stock days, this equals $13,680 extra stock before arrivals.
- Calculate per outlet since demand scales differently.
- Adjust for longer stays, which may affect on-property dining frequency, by calibrating against last peak’s outlet sales.
- Use forward-looking par levels for pre-season stock building; switch to usage-based pars once peak data accumulates.
Plug in your own numbers below.
How should restaurants, bars, and banquets each prepare?
Each outlet relies on different demand drivers: restaurants on covers per occupied room, bars on pour volume, and banquets on contracted headcounts confirmed weeks in advance.
- Restaurants: Predict covers by meal period and purchase proteins and produce based on that forecast, rather than relying on the August par sheet.
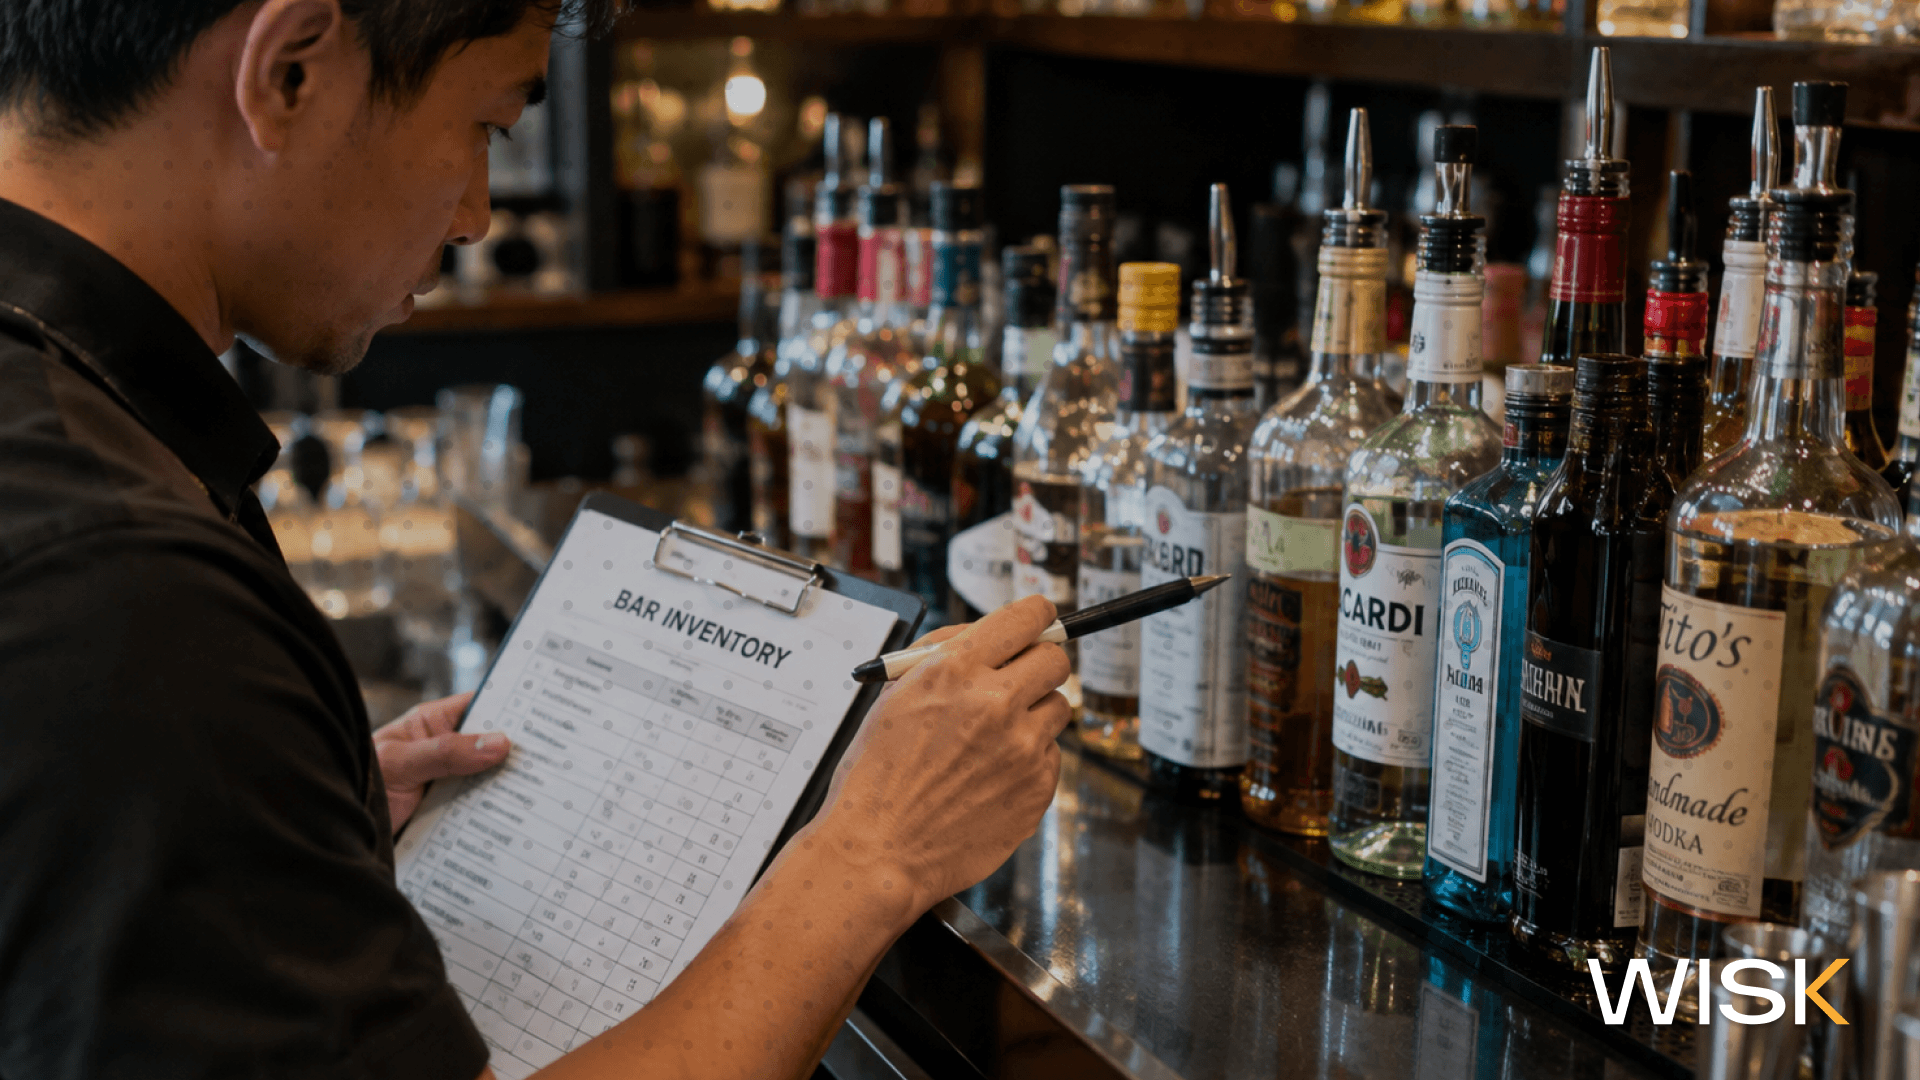
- Bars: Stock up early on top-selling spirits and wines, which keep well, while ordering kegs, citrus, and garnishes on a weekly basis.
- Banquets: Use confirmed banquet event orders as firm numbers to incorporate into the forecast as soon as contracts are signed.
- Pool bars, grab-and-go, and in-room dining: These smaller outlets tend to run out of stock first due to limited inventory. Assign each its own par level instead of depending on restocking from the main storeroom.
How does manual seasonal preparation compare to WISK?
Manual preparation depends on fixed pars and manual counts, whereas WISK.ai integrates sales data from over 60 POS systems, performs inventory counts up to five times faster using barcode scanning against a database of more than 200,000 products, and recalculates pars based on the last six weeks of consumption and sales data.
For an F&B Director managing multiple outlets, the difference becomes apparent during the pre-season inventory and continues through the first month of peak season.
The row that matters most in season is the last one. At peak volume, a variance you catch in week two costs a fraction of one you find at month-end.
How much can improved forecasting reduce F&B waste during peak season?
According to a Champions 12.3 study of 42 hotels across 15 countries, the average hotel saved $7 for every $1 invested in reducing kitchen food waste, achieving a 21% reduction in waste by weight within the first year.
- Minimizing overproduction was a key strategy identified. Many hotels had at least one menu item that was consistently under-ordered, highlighting a forecasting issue before it became a kitchen problem.
- More than 70% of the hotels recovered their investment within the first year, and 95% did so within two years.
- Buffets were among the largest contributors to hotel food waste in the study, so breakfast production should be sized according to occupancy forecasts rather than assuming full capacity.
- Equally important during snowbird season is avoiding stockouts of popular items, as running out of a best-selling bottle at peak times results in lost sales and diminished guest trust.
How does WISK assist hotels in preparing F&B for snowbird season?
WISK transforms seasonal demand into fully stocked outlets by leveraging POS data from over 60 integrations, setting pars based on actual consumption, and enabling inventory counts up to five times faster across all restaurants, bars, and banquet areas.
F&B Directors receive item-level par recommendations for each outlet before guests arrive. General Managers gain real-time visibility into sales and inventory across the entire property. Operators of resorts and seasonal properties benefit from a dynamic process that adapts to each season rather than repeating past approaches. Schedule a demo with WISK to ensure every outlet is fully prepared before your snowbirds arrive.