

What's inside?
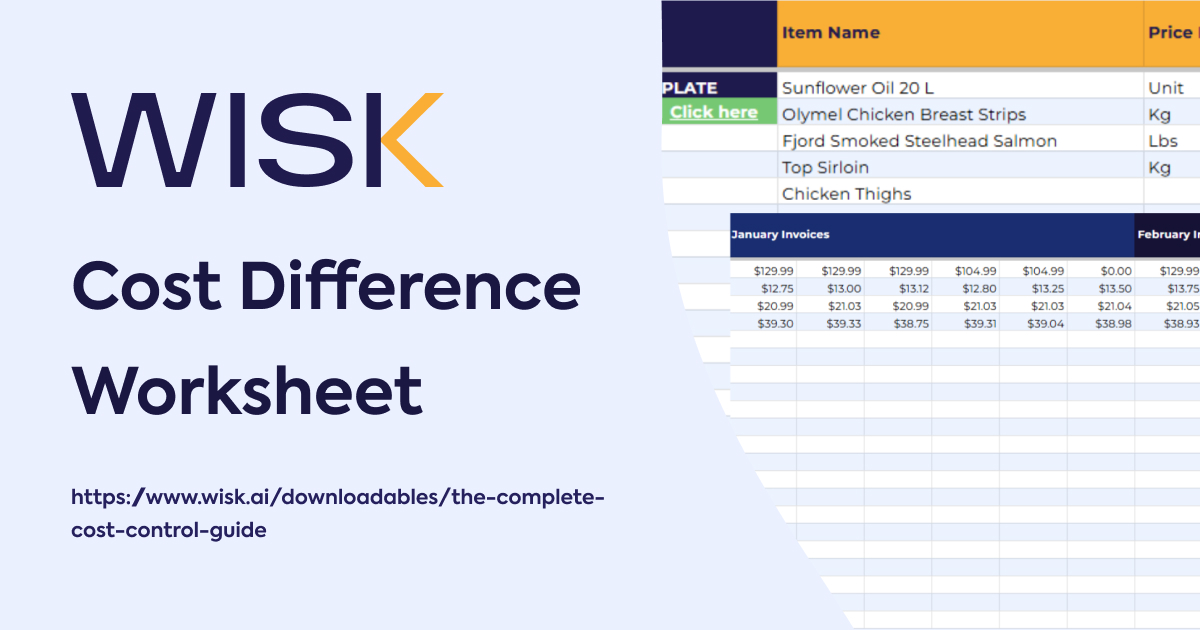
- Four connected tabs — an Items sheet where you enter each invoice price by unit of measure, plus three that calculate automatically: Monthly Price Average, Quarterly Average, and Price Difference — tracking the unit cost of every ingredient across each invoice, month, and quarter.
Track Every Price Change With This Worksheet
A cost difference worksheet is a purchasing record that tracks the unit price of each ingredient across invoices and measures how it changes period over period. It converts a stack of invoices into a single view of where your costs are drifting.
Supplier prices rarely move all at once — they creep. A few cents per kilo on one protein, a case-price bump on another, and your food cost climbs without a single menu change. Food and beverage COGS typically runs 28–35% of sales, so a two- to three-point drift in ingredient cost is the difference between a healthy period and a tight one. This worksheet makes that drift visible in dollars and cents.
How Do I Use the Numbers to Protect Margin?
Start with the Price Difference tab. It shows the month-over-month change for every item, so you can see exactly which ingredients moved and by how much. From there:
- Flag the increases worth a conversation, and take the invoice history back to the supplier to negotiate or re-source.
- Re-cost any menu item built on an ingredient that has drifted, and adjust the price or the recipe before the margin erodes.
- Read the quarterly average to separate a one-off spike from a sustained trend.
Enter the data consistently and the worksheet becomes an early-warning system for cost — not a report you read after the quarter is already lost.
Margin is rarely lost in one bad decision — it leaks a few cents at a time. The operators who protect it are the ones who track every price, on every invoice.


.svg)