Control Bar Costs with Actual vs Theoretical Inventory Variance
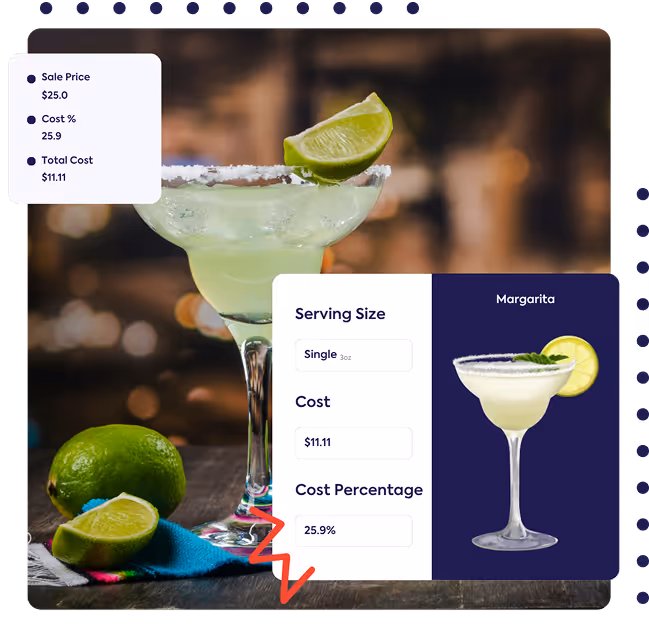
Pinpoint every ounce lost—and every dollar leaking from your bar.
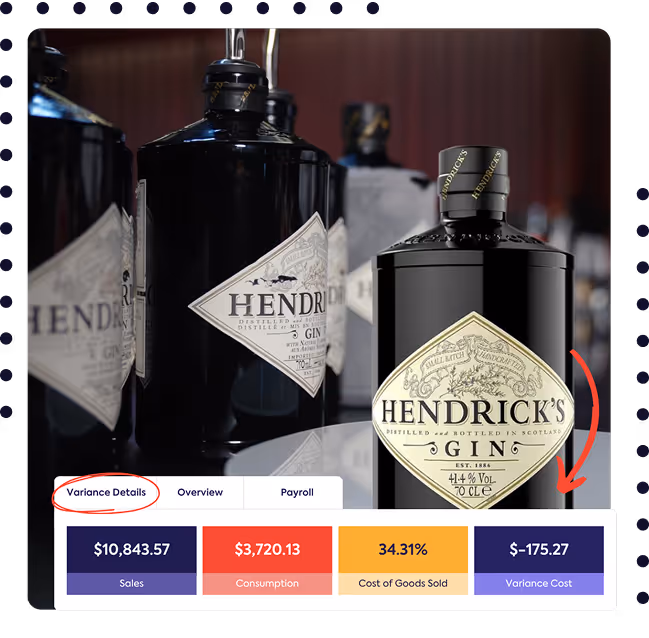
Your POS shows what was sold. WISK shows what was actually used. The difference? That’s your profit margin talking.
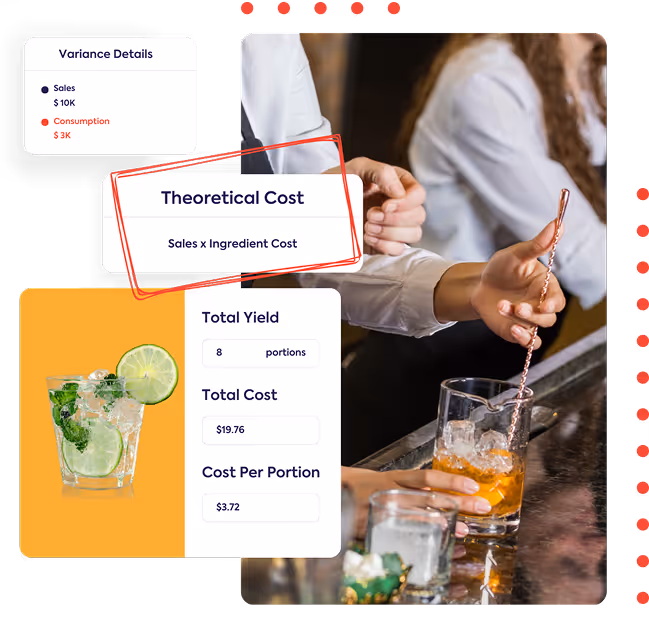
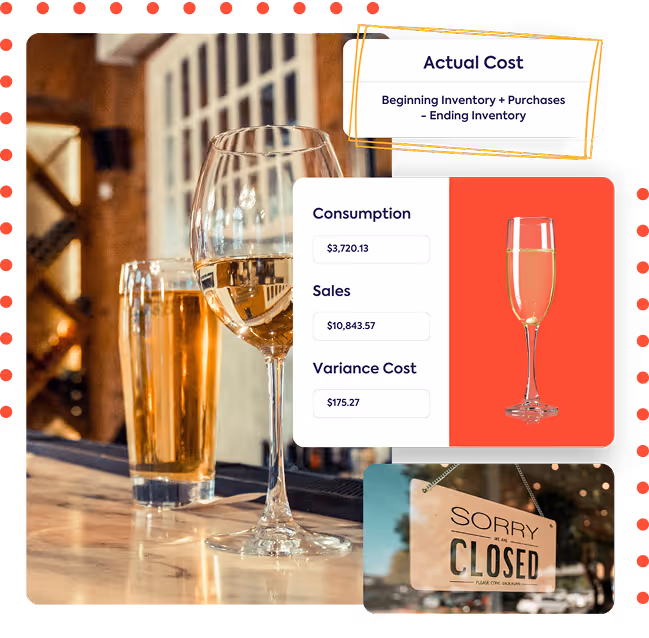
WISK's Actual vs Theoretical tool tracks what should have been consumed based on sales and recipes—then compares it to what was actually poured, based on inventory and invoices. Every variance is an insight waiting to be acted on.


.avif)