Sync Sales Data for Instant Real-Time Insights

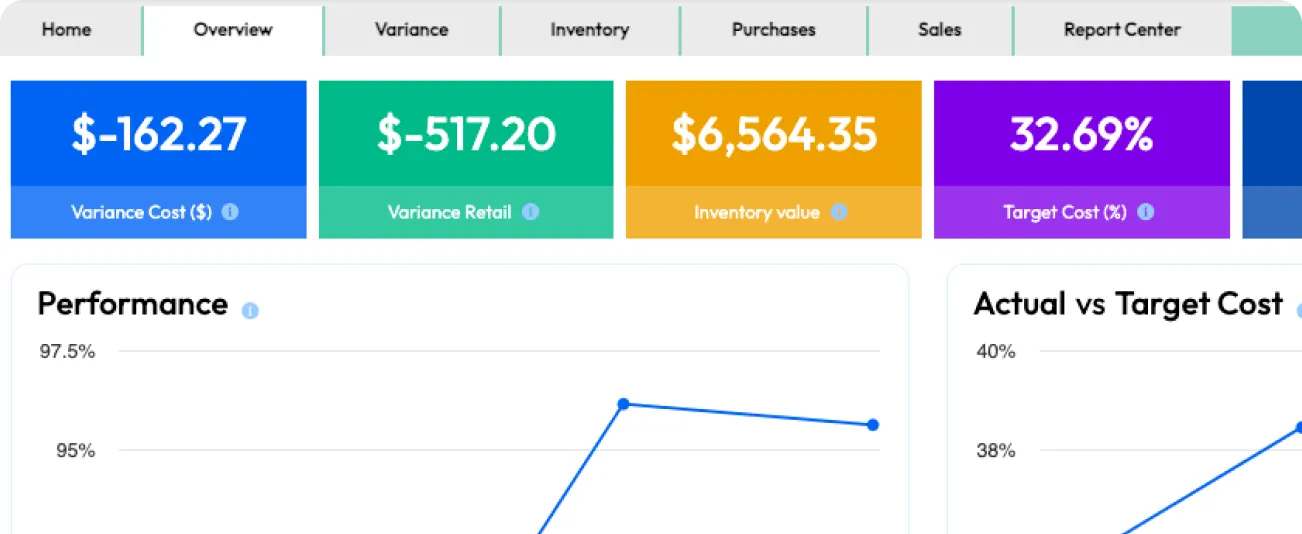
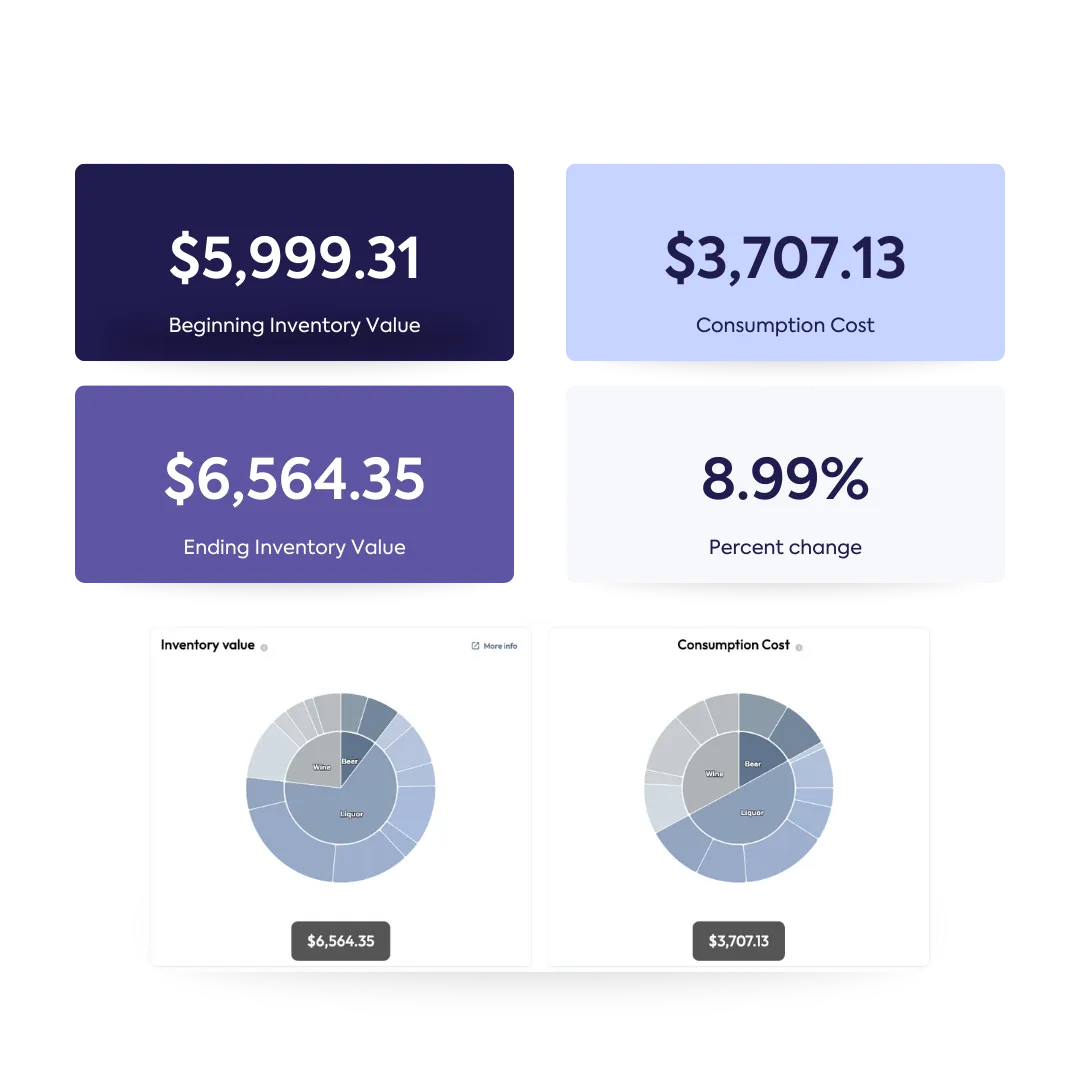
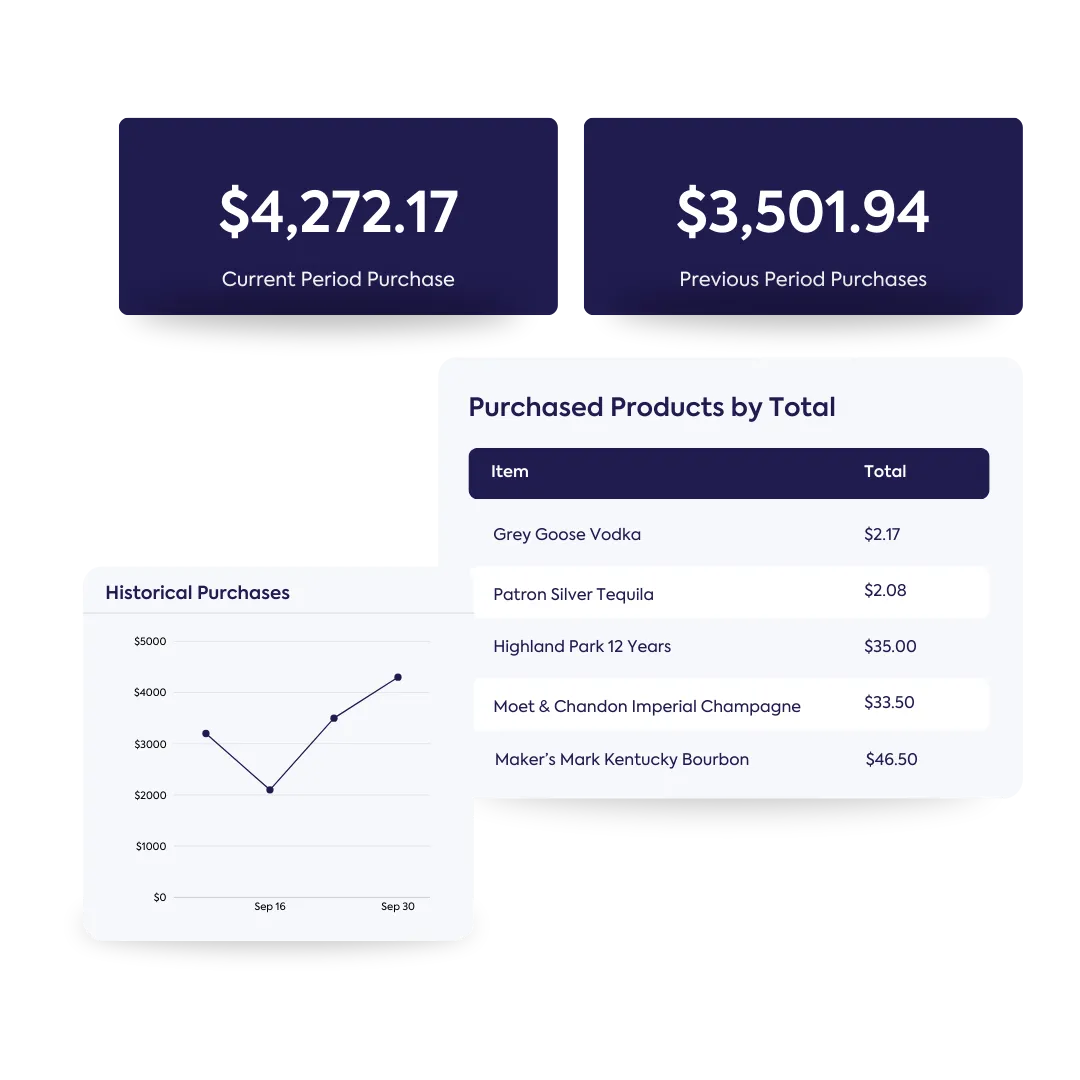
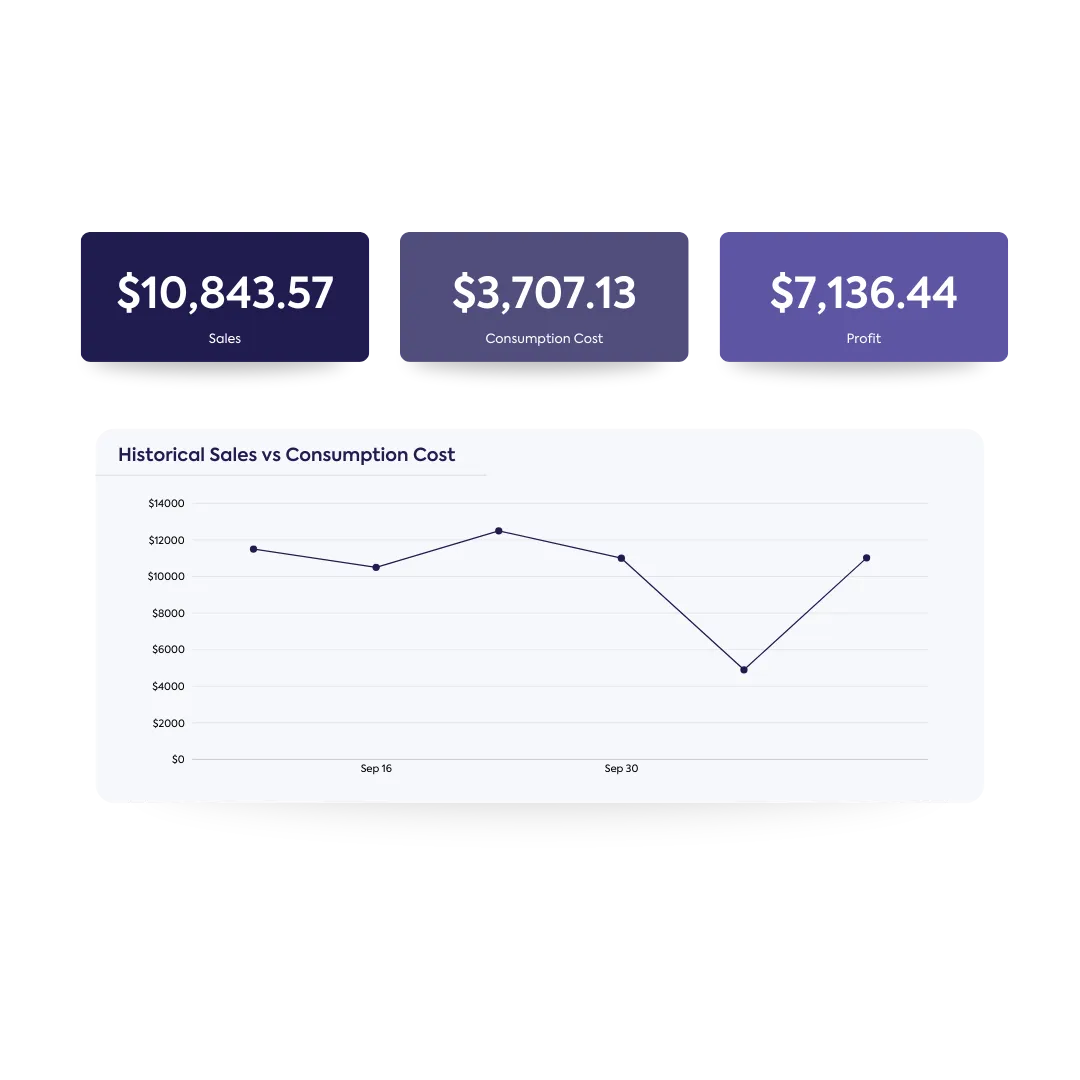
With over 50 POS partners, WISK.ai seamlessly connects to your system to identify profitable items, detect discrepancies between sales and inventory, track cost percentages, and more.

Quick, actionable data for better, faster decisions.

A group of friends cheers with cocktails, while a person works on a laptop below. Overlaid panels show "Total Revenue" and "Menu Cost %" data with "Current," "Variance," and "Original" figures, plus a "Sync Sales Data" toggle. This image highlights how WISK.ai connects to POS systems for actionable data and insights to identify profitable items and track costs.

Stay on top of profits without the spreadsheet hassle

WISK compares sales and consumption data to help you make smarter menu and inventory choices. WISK provides visibility into where your profits and losses are coming from, so you can take action to improve your beverage operations.

A vibrant Tequila Sunrise cocktail with an orange slice and cherry garnish is shown, with digital data panels overlaid. These panels display "$120,939.89 Variance Cost," "$72,394.19 Consumption Cost," and a table with "Total Profit $47,041," "QTY Sold," "Menu Name," and "Total Revenue," illustrating how to "Stay on top of profits without the spreadsheet hassle." The Total Profit figure is circled in red.

Price Difference Reports

Stay on top of the latest pricing changes with up-to-date price difference reports, ensuring you’re always informed and in control.

A bottle of Stag's Leap Wine Cellars Artemis Cabernet Sauvignon is shown, with an overlaid data panel revealing "Stag's Leap Winery Cabernet" and a price difference of "$2.48" (5.22%). A table below displays "Previous Cost Per Unit" and "New Cost Per Unit" for the wine, highlighting up-to-date price difference reports for staying informed.
A bottle of Jack Daniel's Tennessee Whiskey is featured alongside its box. An overlaid digital panel titled "Order 5500 to Sample Distributor" shows a purchase history report with "Title," "Stock," and "Cost per unit" for Jack Daniel's and Hendricks Gin, illustrating a central location for tracking invoices and purchase orders.

Purchase History Reports

Keep track of every invoice and purchase order in one central location with our purchase history reports. Never worry about losing a record again—everything is securely stored and easily accessible.

Cost History Reports

Take the guesswork out of managing your bar. Get precise data on liquor, beer, wine, and mixer costs to make smarter decisions on where to cut back and invest in your bar's success.

A bottle of Modelo Especial beer and a bottle of Heineken beer are shown, with an overlaid menu for selecting a "Date Range" (with "Last 30 days" highlighted). Below this, a "Cost Changes" table lists the "Previous Cost" and "New cost" for various spirits and beers, including Modelo, Heineken, Jameson, Tanqueray, and Bulleit, demonstrating a tool for making data-driven decisions on bar inventory.
 A person types on a laptop in a bar setting, with a "Price Change Alert" notification visible. An overlaid panel shows details for "Stag's Leap Winery Cabernet," including "Difference Amount $2.48" and "Difference Percentage 5.22%," highlighting WISK's instant alerts for cost management.

Smart Cost Alerts to Keep Your Spending in Check

Stay ahead of costs with WISK's instant alerts. Get notified immediately when changes occur, so you can react fast and save money.

See how we’ve helped
our clients succeed

Save 4.5 Hours Every Week
Sid Patel - Managing Partner Brass Tap Franchisee
The Brass Tap Franchisee, Sid Patel

“I tried four different inventory systems, and nothing compared to WISK. It cut our inventory time by more than half, and the reports are amazing – it's a game-changer."

From 2 hrs inventory time to 20 mins
Loyd Von Rose - Owner L'infame Titt.le Tattle
L’infâme Tittle Tattle Owner, Loyd Von Rose

“WISK streamlined our chaotic inventory, saving time, reducing labor costs, and preventing theft. It's easy for my staff to manage, and we've seen significant savings.”

See how you perform real-time or for a selected inventory period using our tab

Overview

The Overview tab provides insights into your performance for the selected inventory period, and compares it to the past to spot any trends.

Variance Tab

See how your variance cost is calculated with our Variance tab. With this data, you can see where your problem points are, including which items are most responsible for your losses.

A collage displays a chef organizing produce in a walk-in cooler, and a person using a tablet with a graphic showing location pins on boxes. Overlaid is a digital dashboard with "Beginning Inventory Value $5,999.31," "Consumption Cost $3,707.13," "Ending Inventory Value $6,564.35," and an "8.99% Percent change." Two pie charts for "Inventory value" and "Consumption Cost" are also visible, demonstrating how variance cost is calculated to identify items responsible for losses.
A collage of images and data panels related to inventory management and cost analysis. At the top, a laptop screen displays a dashboard with pie charts, a graph, and financial figures like "$10,843.57 Actual Sales" and "$13,720.13 Theoretical Sales." A person in a chef's hat is seen storing produce in a walk-in cooler, while another person uses a tablet with a graphic showing location pins. A final image shows a wok with flames in a commercial kitchen. The panels highlight a "Cost Analysis" graph and a breakdown of "Beginning Inventory Value," "Consumption Cost," and "Ending Inventory Value," demonstrating how WISK tracks inventory and consumption to calculate COGS and optimize counting times.

Inventory Tab

Compare the beginning and ending counts in your selected inventory period. WISK provides you a breakdown of your consumption (COGS) and shows you the progression of your inventory durations / counting times.

Purchases Tab

See the breakdown of your purchases for your selected inventory period and compare your spending to previous inventory periods. Say goodbye to assuming if you are over purchasing or why you have an extra two bottles of Dom Pérignon at the back.

A collage of data panels for inventory management. The top shows "$4,272.17 Current Period Purchase" and "$3,501.94 Previous Period Purchases." Below, a line graph titled "Historical Purchases" shows spending trends over time. A table titled "Purchased Products by Total" lists "Grey Goose Vodka," "Patron Silver Tequila," and others with their costs, demonstrating a breakdown of purchases for comparing spending between periods.
A data dashboard shows three key metrics: "$10,843.57 Sales," "$3,707.13 Consumption Cost," and "$7,136.44 Profit." Below, a line graph titled "Historical Sales vs Consumption Cost" plots two converging lines over time, demonstrating the relationship between sales and consumption for business growth.

Sales Tab

See the difference between your sales and consumption overtime. Let the record show your sales by family(category) and highlight your top sellers (by total sales and by profit) so you can focus on what matters the most—growing your business.

Learn how we can optimize workflows across your team

Beverage Director
Beverage Director
Bar Manager
Bar Manager
Sommelier
Sommelier
Head Bartender
Head Bartender
Inventory Specialist
Restaurant Owner
Bar Owner
Purchasing Manager
Purchasing Manager
Barista
Barista

Ready to take your restaurant & bar to the next level?

  • Take food and beverage inventory 5x faster

  • Scan invoices and update COGS instantly

  • Save time and decrease waste with ordering and receiving

  • Create a profitable menu with recipe management

See for yourself! Fill the form to schedule a free demo customized to your restaurant needs.
Thank you! Your submission has been received!
Oops! Something went wrong while submitting the form.