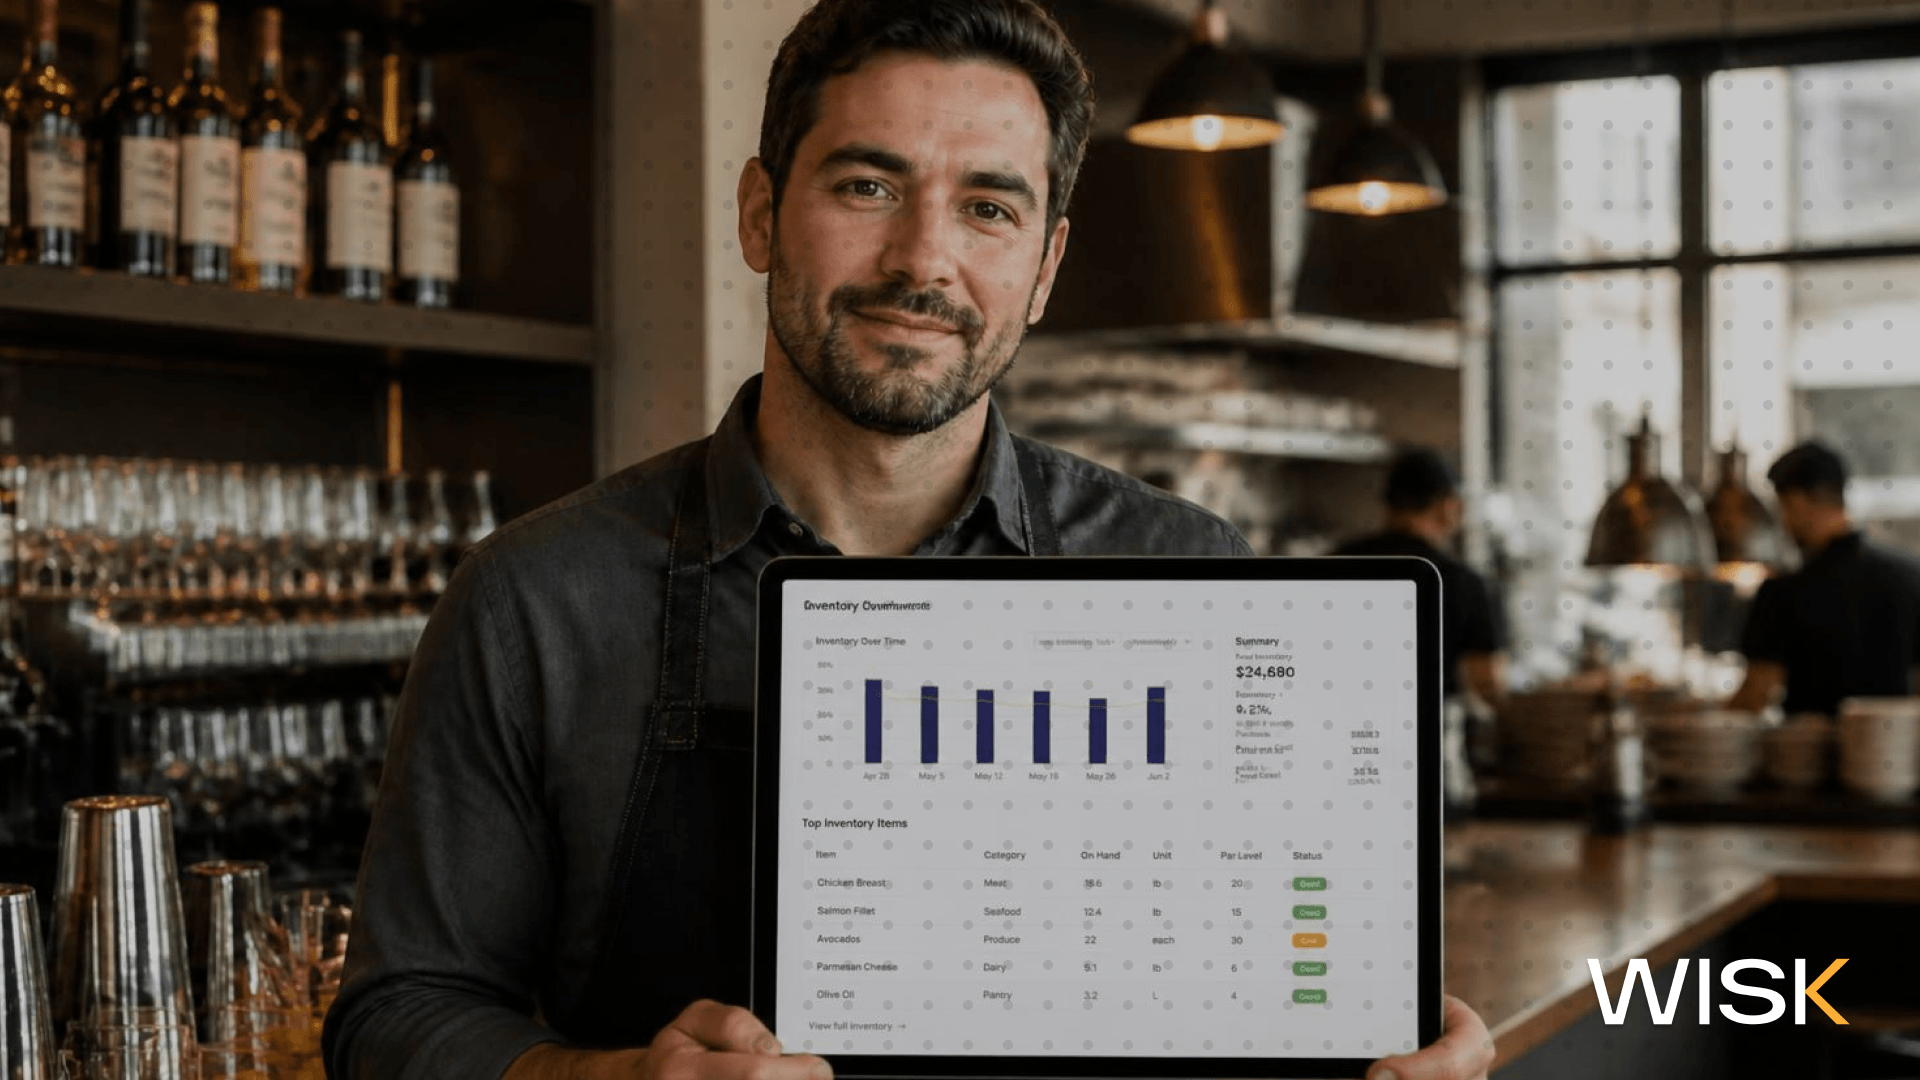
En resumen: Prepárate para la temporada de fútbol estableciendo tus niveles de stock (par levels) a partir de los datos de ventas de los días de partido de la temporada pasada, generando un informe de variaciones la mañana siguiente a cada encuentro y automatizando tus conteos para que un domingo a tope no arruine tu lunes. WISK gestiona los tres aspectos en un único sistema de gestión de inventario —reduciendo el tiempo de inventario en un 80% con una precisión del 99,7%—, para que los propietarios de bares deportivos, gerentes de bar, directores de bebidas y gerentes de tabernas de cervecerías lleguen al inicio de la temporada con el stock adecuado detrás de la barra y un registro claro que respalde las cifras.
¿Por qué la temporada de fútbol americano pone a prueba tu inventario más que cualquier otra época del año?
Los fines de semana de fútbol representan el pico de demanda más grande e impredecible de tu calendario: los bares deportivos experimentan un aumento aproximado del 38% en el tráfico de los domingos durante la temporada de la NFL, y el volumen de bebidas sube entre un 20 y un 30% en los días de partido en comparación con un turno normal. Ese tipo de fluctuación es precisamente donde el hábito de conteo manual empieza a fallar silenciosamente.
Esto es lo que realmente sale mal cuando empieza la temporada:
- El sistema que funcionaba en julio no puede seguir el ritmo de 18 semanas de partidos consecutivos, y los pequeños errores de conteo se acumulan rápidamente.
- Los directores de bebidas que realizan pedidos basándose en un nivel de stock semanal fijo se quedan sin los productos de mayor rotación antes del tercer cuarto y terminan con exceso de los que se venden poco.
- Los gerentes de bar pierden por completo el conteo tras el turno porque el equipo está desbordado, por lo que el lunes comienza con una suposición en lugar de una cifra real.
Si haces los números, el tráfico es real. Los datos locales de CGA muestran que los bares deportivos superan al establecimiento promedio en alrededor de un 38% los domingos de la NFL, lo cual es excelente para los ingresos brutos, pero brutal para cualquiera que esté contando botellas a mano.

¿Cuánto inventario adicional necesitas realmente para la afluencia de los días de partido?
Ajusta tu pedido a la demanda, no al instinto: con un gasto promedio de los aficionados de unos 66,60 $ los domingos de la NFL y picos de ventas del 20 al 30%, la mayoría de los bares necesitan aumentar sus niveles de stock para los días de partido entre un 20 y un 40% en cerveza y licores básicos : una cifra que la previsión de ventas puede determinar a partir del historial de tu propio TPV en cuestión de minutos. Calcular por exceso inmoviliza efectivo en stock muerto; calcular por defecto significa que te quedarás sin el producto favorito del público antes del medio tiempo.
La trampa en la que caen la mayoría de los operadores es tratar todos los partidos por igual. Una rivalidad divisional con el local lleno no es lo mismo que un partido de jueves por la noche, y tu pedido debería reflejar eso. Cuando analizas el gasto por aficionado y el pico de ventas del 20 al 30% en los días de partido, la estrategia más inteligente es realizar previsiones cada semana basadas en datos de consumo reales en lugar de usar una hoja de stock estática.
Desglosa la previsión por categoría, ya que no se mueven al mismo ritmo:
- La cerveza de barril y nacional experimentan la mayor fluctuación en los días de partido; aquí es donde una rotura de stock duele más y donde deberías establecer el margen de seguridad más amplio.
- Los licores básicos y de marca aumentan de forma constante a lo largo del día; vigílalos para el exceso de vertido, no la falta de existencias.
- Bebidas sin alcohol y cerveza sin alcohol son la categoría silenciosa de mayor crecimiento, y quedarse sin ellas aleja a la mesa del conductor designado que está pagando la cuenta de la comida.
Para los gerentes de salas de degustación de cervecerías, la misma lógica se aplica a su propia oferta de grifos: pronostique qué estilos vacía primero el público local y programe la rotación de sus tanques de servicio en función de ese calendario, en lugar de reaccionar ante un barril vacío a mitad del turno.
Haga sus propios cálculos antes de realizar el pedido:
Utilice la calculadora de arriba para verificar su próximo pedido. Es una herramienta orientativa, pero convierte el "creo que necesitamos más cerveza" en una cifra monetaria con la que realmente puede trabajar, y le muestra cuánto dinero está perdiendo probablemente por variaciones antes de que lo solucione.
¿Cuánto le cuesta realmente adivinar su inventario para los días de partido?
Adivinar sale caro: entre el 20 y el 30 % de los activos líquidos de un bar típico desaparecen debido al exceso de vertido, los derrames y los robos, y esas pérdidas se disparan en los días de gran volumen de partidos cuando el equipo está desbordado. Los informes de variación y las funciones de gestión de costes de WISK revelan exactamente por dónde se escapa el dinero, hasta el último mililitro. En un domingo ajetreado de fútbol, unos pocos mililitros de más por cada bebida, multiplicados por cientos de consumiciones, suponen una pérdida real de dinero.
Esta es la parte que los propietarios subestiman. No se trata de un robo dramático, sino de una pérdida constante:
- Servir copas demasiado llenas durante las horas punta sin que nadie lo controle en tiempo real.
- Bebidas invitadas o derramadas que nunca se incluyen en el recuento.
- Barriles que se "vacían" más rápido de lo que indica el TPV.
Pongámosle cifras. Si tu bar factura 24.000 $ semanales en bebidas y pierdes un 20% por variaciones, son aproximadamente 4.800 $ a la semana que se escapan, y en las semanas de partido la cifra es aún mayor. A lo largo de toda la temporada, esa es la diferencia entre un buen año y uno estancado, y la mayoría de los gerentes no lo perciben porque la pérdida se reparte en miles de pequeñas consumiciones.
El análisis de los días de partido de Toast respalda por qué esto es importante: sus datos muestran un aumento en el volumen de alcohol los domingos durante la temporada en las ciudades de la NFL, lo que significa que el momento en el que más sirves es precisamente cuando la variación es más difícil de detectar manualmente. Las funciones de gestión de costes existen para que detectes la fuga el mismo día que ocurre, no cuando el recuento mensual revela un agujero que no puedes explicar. Ese es el objetivo de un informe de variaciones vinculado a los datos del TPV en tiempo real: identifica el problema mientras aún estás a tiempo de hacer algo al respecto.
Preparación manual para el día del partido frente a WISK: ¿qué cambia realmente?
La diferencia es cuantificable: la preparación manual consume todo un turno y depende de estimaciones visuales, mientras que el sistema de gestión de inventario de WISK realiza recuentos hasta 5 veces más rápido con una precisión del 99,7% y genera documentación automatizada que puedes entregar a un propietario o auditor al instante. El mismo trabajo, en una fracción del tiempo y con cifras que realmente puedes defender.
¿Cómo crear una lista de control de inventario para el día del partido que realmente vayas a reutilizar?
Créala una vez y úsala cada semana: un recuento estandarizado antes y después del partido, integrado en la lista de control de WISK, garantiza que cualquier gerente de turno siga el mismo proceso, manteniendo tus datos impecables desde la primera semana hasta los playoffs. La constancia es lo que hace que las cifras de toda la temporada sean fiables.
Especialmente para los gerentes de cervecerías y bares, la lista de control es donde reside la disciplina. Una rutina repetible se ve así:
- Jueves: Obtén el informe de previsión de ventas, establece los niveles de existencias para el día del partido y realiza el pedido.
- Antes del inicio: Realiza un recuento rápido de los productos de mayor rotación para conocer tu punto de partida real.
- Después del partido: Ejecuta el recuento y el informe de variaciones mientras el turno está reciente, no tres días después.
Como cada recuento alimenta la Documentación Automatizada, no solo te mantienes organizado para esta semana, sino que construyes el historial temporada tras temporada que hace que la previsión del próximo año sea más precisa. Esa es la ventaja acumulativa que los propietarios de bares deportivos pierden cuando tratan el inventario como una tarea tediosa en lugar de un activo de datos.
¿Cómo ayuda WISK a que tu bar triunfe durante la temporada de fútbol americano y atraiga a clientes para ver los partidos?
WISK ofrece a los propietarios de bares deportivos, gerentes de bar, directores de bebidas y gerentes de salas de degustación de cervecerías un único Sistema de Gestión de Inventario para la previsión de ventas, informes de variaciones, funciones de gestión de costes, integración de listas de verificación y Documentación Automatizada, para que puedas abastecerte de forma inteligente, servir con rentabilidad y dejar de perder beneficios por culpa de las suposiciones.
El inicio de la temporada es el periodo de mayores ingresos de todo el año; los bares que lo tratan como un problema de datos, y no como un problema de ajetreo, son los que mantienen el margen. Reserva tu demostración gratuita de WISK y prepárate para el próximo partido en casa.