The Bottom Line: Manual inventory costs you twice — it takes over three hours a week to complete, and the inaccuracies mean you lose margin by the time you're finished. WISK.ai replaces the clipboard with a scan-and-weigh system linked to a database of over 200,000 products. It measures actual usage against POS sales, providing variance down to the ounce with an attached dollar value. Operators using WISK complete inventory counts up to five times faster, reduce shrinkage by as much as 80%, and increase profit margins by 3–7%.
We spoke with the WISK sales team to understand the real concerns operators raise on initial calls—not marketing speak, but the genuine issues they hear daily. Five key challenges emerged repeatedly. Here they are, in their own words, with the underlying numbers explained below.
Why does a manual inventory count take three hours and still come out wrong?
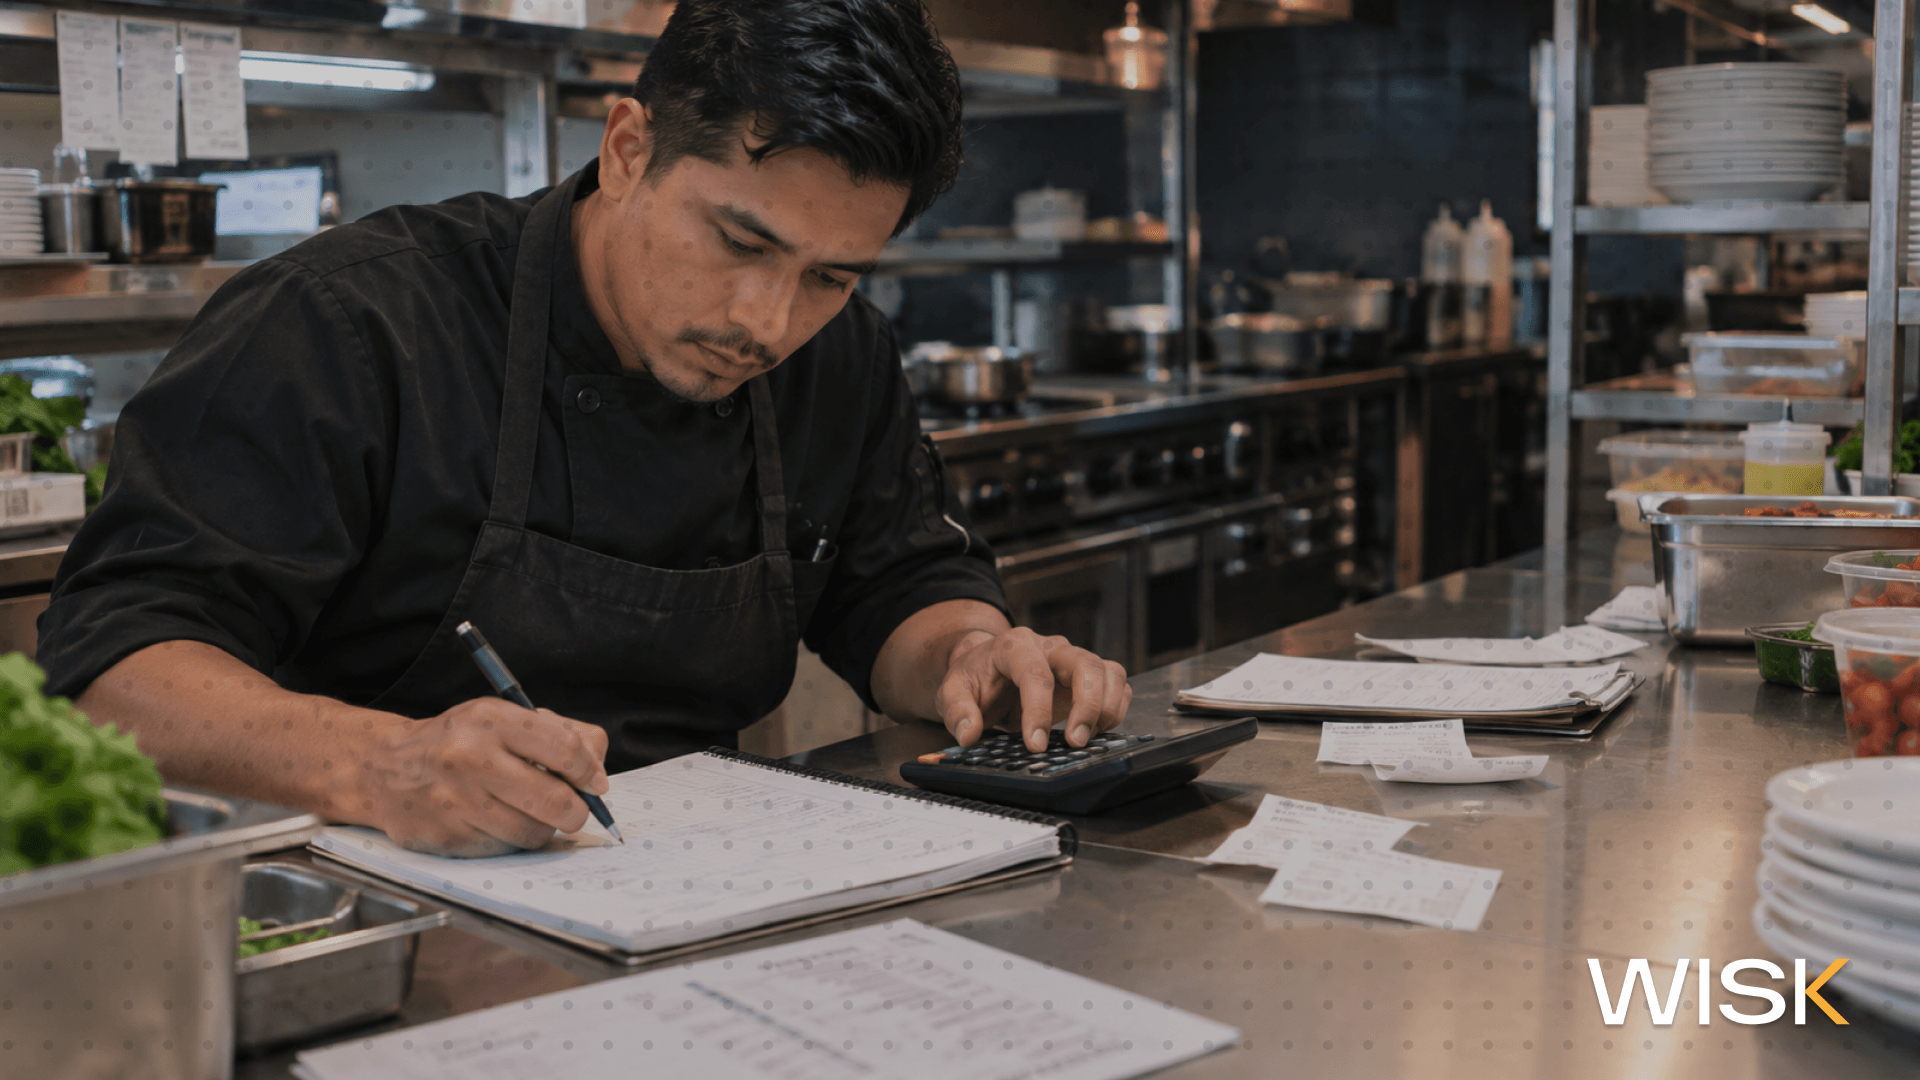
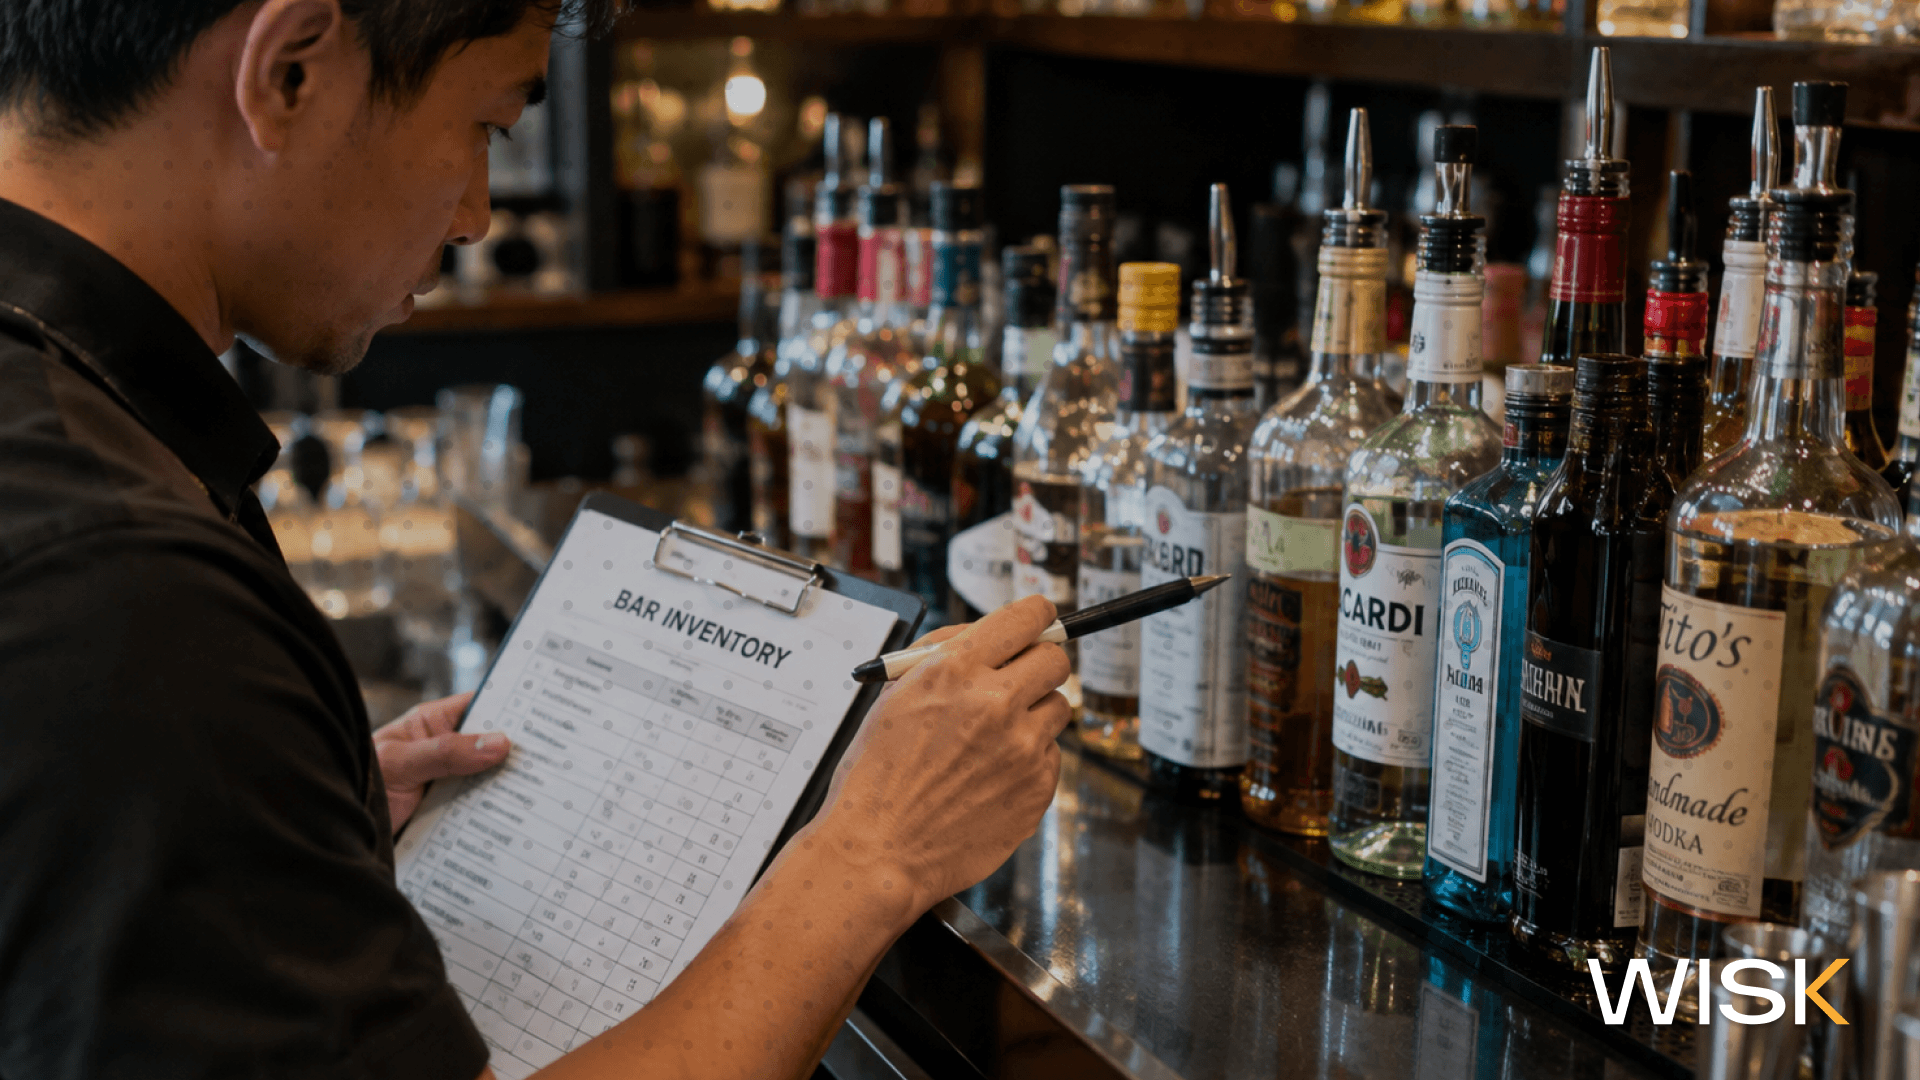
A manual inventory count for a single venue typically takes at least three hours each week. Estimating the remaining amount in a partially used bottle can lead to errors of up to 2 ounces every time. WISK streamlines this process, completing the same count up to five times faster, some venues finish in just 20 minutes—by using a scale instead of relying on visual estimates.
"If you're doing an inventory count for a venue, it'll take three hours or so per week at a minimum. You use an Excel spreadsheet, you hold up a bottle and go like this, and you're like — how much is left in there? It's a nightmare. I could be off two ounces every single time I count inventory."
— WISK sales team
That's the entire task, described honestly. It's not a matter of skill. No one can accurately gauge 2 ounces of clear liquid through green glass, so the error varies each week, making your trend data unreliable. A survey by Oracle Hospitality and Technomic found that two-thirds of independent restaurants spend about three hours weekly managing inventory, with most lacking any forecasting system. The other issue is what those three hours actually yield: just a snapshot of current shelf stock. Tracking usage, calculating cost of goods, and determining variance require additional effort. The burden falls on GMs, bar managers, and beverage directors, who spend their Sundays counting bottles instead of coaching their teams.

How Much is Invoice Price Creep Costing You Per Drink?
Ingredient prices fluctuate constantly and quietly. One operator discovered tequila had increased by 80 cents per margarita — at 1,000 margaritas sold weekly, that’s a staggering $800 lost every week and over $41,000 annually from just one ingredient in one cocktail.
"Ever since COVID, every time you buy something it's a little bit more expensive than it was last time. You used to get away with costing out your menu once or twice a year. Now you have to do it almost weekly, because things are up and down so much. We caught the tequila go up 80 cents on a margarita. Eighty cents times 1,000 drinks sold per week — that's $800 a week."
— WISK sales team
Twice-a-year costing made sense when prices were stable. Today, that's no longer the case. According to the National Restaurant Association's food cost tracking, the Producer Price Index for All Foods remains over 33% higher than it was in February 2020, as of August 2026 — and that's just the average. Individual commodity prices swing dramatically, often without warning.
You won't get a heads-up either. Price hikes show up buried three invoices deep, and restaurant owners or multi-unit operators usually only notice at quarterly P&L reviews when food costs have jumped by two points—and no one can pinpoint which items caused the increase. Plug in your own numbers and see the impact for yourself:
What is variance, and why can't you get it from a spreadsheet?
Variance is the difference between what you actually use and what your POS system says you sold. While a 1–2% variance is considered acceptable, real-world shrinkage in food and beverage often runs much higher. WISK handles this automatically, integrating with over 60 POS systems to provide precise variance measurements down to the ounce, complete with a dollar value for every item.
"It's what people come to us for: variance. Actual versus theoretical, and how hard that is to get when you do things manually. Being able to have a system, integrate your POS, and actually make your inventory numbers give you the full story."
— WISK sales team
The industry standard for inventory variance is typically between 1% and 2%, yet many bars and restaurants experience variances ranging from 5% up to 25%. This wide gap highlights the critical need for precise measurement.
Achieving accurate variance calculations manually requires constructing a detailed theoretical usage model that accounts for every recipe and pour specification aligned with actual sales each week. This process is rarely executed effectively. Without integration with a POS system, restaurants rely on physical counts compared against rough estimates, resulting in subjective impressions rather than reliable data—making it impossible to enforce accountability.
When POS integration is in place, the approach transforms for hospitality groups, hotel food and beverage directors, and nightclub operators. Instead of vague concerns like "liquor costs seem high this month," managers receive concrete insights such as "this specific vodka brand is 11% over budget, costing us $280 monthly." This precise data empowers actionable decisions starting Monday morning.
Do you have to weigh every bottle and enter tare weights yourself?
No. Simply scan the barcode, place the bottle on the Bluetooth scale, and move on. WISK's extensive database includes over 200,000 SKUs with pre-stored empty bottle weights, which significantly contributes to the platform's 99.7% inventory accuracy.
"One thing that really separates WISK from our competition is our Bluetooth scale — the ability to scan and weigh. It's tied to 200,000 SKUs and barcodes, so they understand they don't need to put the tare in. 'Well, do I have to add like the bottle weight?' No, it's already there. Don't worry about that. It's less work."
— WISK sales team
This question comes up in almost every demo and often determines whether a system sticks around past the first few weeks. If you ask a bar manager to manually look up tare weights, the whole process usually fizzles out, and the spreadsheet makes a quiet comeback by the second month.
With WISK, it’s simple: scan the barcode to identify the product, place the bottle on the Bluetooth scale, and the system automatically subtracts the pre-stored tare weight. What you get is an exact remaining volume in ounces—no guesswork involved. This means even a seasonal bartender can confidently run an accurate inventory count on their second shift. Plus, shifting from monthly to weekly counts becomes practical, catching issues early enough to take action before they escalate.
How do smarter orders keep more money in your pocket?
Ordering based on intuition ties up cash unnecessarily. WISK generates recommended orders using your venue's actual historical consumption, enabling operators to reduce inventory expenses by up to 15% without altering their menu or prices.
"Especially from an operator standpoint, it's keeping more money in their pocket. How? By placing smarter orders based on historical usage and actual data. Less money on shelves, more money in your pocket."
— WISK sales team
Every unused case represents working capital that could otherwise be invested in labor, equipment maintenance, or rent. Over-ordering is a hidden cost—it doesn't appear as an immediate loss but manifests as inflated invoices and storage areas cluttered with excess stock.
For purchasing managers and operators managing multiple locations, conducting consistent weekly inventory counts is essential. These regular counts ensure that par levels are accurate and reliable, rather than outdated estimates from years past. By analyzing usage data, businesses can anticipate seasonal demand shifts proactively, avoiding costly last-minute purchases at retail prices, which are often the most expensive.
What actually changes when you move off the spreadsheet?
How does WISK empower you to manage your inventory effectively?
WISK provides bar managers, restaurant owners, beverage directors, and multi-location hospitality groups with a comprehensive solution: quick scan-and-weigh inventory counts, detailed tracking of invoice prices by line item, variance analysis integrated directly from your POS, and order recommendations based on your venue's actual consumption. This translates to saving over 20 hours of labor each month and boosting profit margins by 3–7%. Stop relying on guesses about what's left in the bottle — schedule a free WISK demo and get accurate insights on your next inventory count.